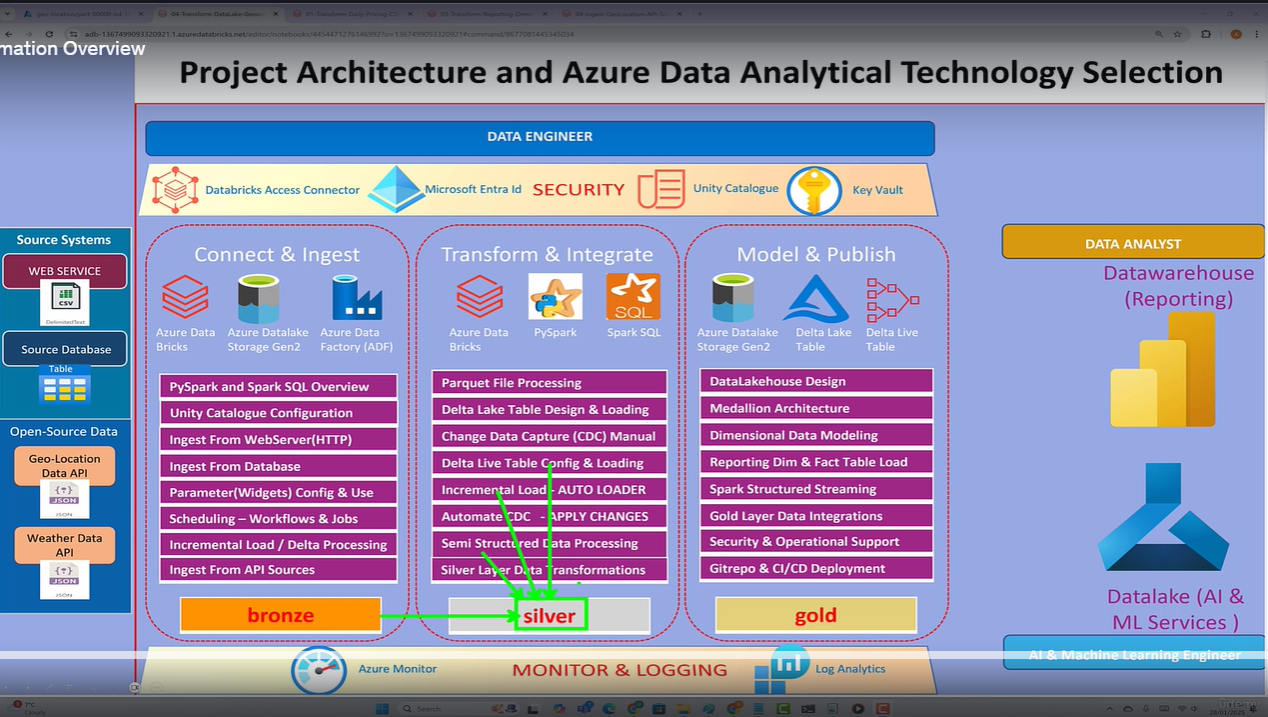
The silver layer acts as a refinement layer where data is cleaned, transformed, integrated, and structured to make it suitable for downstream analytical workloads, reporting, and potentially feeding a data warehouse or specific applications.
Interview Questions :
What are the transform have you done in the silver layer while loading the data into the data lake?
1. Converting the datatype of the data from the bronze layer.
Example (Geocoding Data): The generationtime_ms might have been ingested as a string in the bronze layer. In the silver layer, you would likely convert this to a numeric type (like double or integer) for efficient analysis and querying. Similarly, IDs might be stored as strings initially and converted to long or integer. Latitude and longitude might need to be explicitly cast to double for accurate spatial analysis.

2. Creating the intermediate tables or views to process the reporting dimensions and the fact table.
Example (Geocoding Data):
- Dimensions: You might create dimension tables for geographical entities like
country,admin1(state/region),admin2(county/district), etc. These tables would contain unique values and potentially descriptive attributes. You would extract this information from the nested structure of the geocoding API response. - Facts: The core geocoding information (latitude, longitude, name, etc.) could form a fact table, potentially linked to the market names if that's part of the broader data model.
- Intermediate Views: You might create temporary views to flatten the nested JSON structure or perform initial aggregations before loading into the final dimension and fact tables in the silver layer.

3. Converting the unstructured data, semi-structured data into structured data.
Example (Geocoding Data): The raw JSON response from the Open-Meteo API is semi-structured due to its nested nature (e.g., the results array containing dictionaries with nested address components). The process of extracting specific fields and organizing them into tables with defined columns and data types in the silver layer is precisely converting this semi-structured data into a structured format. The use of pd.json_normalize() (which we discussed earlier, although it wasn't used in the final code shown for Spark) or similar Spark functions to flatten the JSON and then load it into DataFrames (which are structured) is a direct example of this conversion.
Now we are going to convert into semi-structured data (JSON, typically nested list, dict into a structured way.


We have untangled (flattened) one layer of the JSON file by converting it into columns and giving respective column names using aliases.


By using the Explore option in pyspark, we can change the array of elements into column values.

We should not use multiple values in the explore transformation in pyspark code because it just aligns the array values into the column but its does not map the values properly like a dictionary.

geolocationStateTransDF = geolocationSilverDF \
    .select(explode("stateName").alias("col"), monotonically_increasing_id().alias("stateSequenceId"))
Explanation:
-
geolocationSilverDF: This is the input Spark DataFrame, presumably containing a column named "stateName". Based on our previous discussion, "stateName" likely contains an array of state names for each location. -
.select(...): This method selects the columns that will be included in the new DataFrame,geolocationStateTransDF. -
explode("stateName").alias("col"):explode("stateName"): This function takes the "stateName" column (which is assumed to be an array) and creates a new row for each element in the array. The elements of the array become the values in a new default column..alias("col"): This renames the newly created column (from the exploded array elements) to "col".
-
monotonically_increasing_id().alias("stateSequenceId"): monotonically_increasing_id(): This Spark SQL function generates a monotonically increasing 64-bit integer for each row in the DataFrame. The numbers are guaranteed to be increasing and unique within each partition, but not necessarily consecutive or globally unique across partitions..alias("stateSequenceId"): This assigns the alias "stateSequenceId" to the column containing the generated IDs.


geolocationSilverTransDF = geolocationSilverTransDF.join(
    geolocationDistrictTransDF,
    col("stateSequenceId") == col("districtSequenceId")
).select("stateName", "districtName")

display(geolocationSilverTransDF)
Explanation:
-
geolocationSilverTransDF: This is the DataFrame we saw in the previous step, containing columns "col" (renamed to "stateName" in the output table) and "stateSequenceId". -
.join(...): This method performs a join operation with another DataFrame,geolocationDistrictTransDF. -
geolocationDistrictTransDF: This is another Spark DataFrame, presumably containing information about districts. Based on the join condition, it likely has columns named "districtName" and "districtSequenceId". -
col("stateSequenceId") == col("districtSequenceId"): This is the join condition. Rows fromgeolocationSilverTransDFare matched with rows fromgeolocationDistrictTransDFwhere the values in the "stateSequenceId" column are equal to the values in the "districtSequenceId" column. This implies that these sequence IDs are meant to link state and district information. -
.select("stateName", "districtName"): After the join operation, this method selects only the "stateName" column (which was the "col" column after theexplodein the previous step) fromgeolocationSilverTransDFand the "districtName" column fromgeolocationDistrictTransDFto be included in the finalgeolocationSilverTransDF. -
display(geolocationSilverTransDF): This is a Databricks-specific function to display the contents of the DataFrame in a tabular format within the notebook.

geolocationSilverTransDF = geolocationSilverTransDF \
    .join(geolocationDistrictTransDF, col("stateSequenceId") == col("districtSequenceId")) \
    .join(geolocationCountryTransDF, col("stateSequenceId") == col("countryNameSequenceId")) \
    .join(geolocationLongitudeLatitudeTransDF, col("stateSequenceId") == col("latitudeSequenceId")) \
    .join(geolocationLongitudeLatitudeTransDF, col("stateSequenceId") == col("longitudeSequenceId")) \
    .join(geolocationMarketTransDF, col("stateSequenceId") == col("marketSequenceId")) \
    .join(geolocationPopulationTransDF, col("stateSequenceId") == col("populationSequenceId")) \
    .select(
        col("stateName"),
        col("districtName"),
        col("countryName"),
        col("latitude"),
        col("longitude"),
        col("marketName"),
        col("population")
    )

display(geolocationSilverTransDF)
Explanation:
The code performs a series of inner joins:
- It starts with
geolocationSilverTransDF(containing "stateName" and "stateSequenceId"). - It joins with
geolocationDistrictTransDFbased on matching "stateSequenceId" and "districtSequenceId". - It joins with
geolocationCountryTransDFbased on matching "stateSequenceId" and "countryNameSequenceId". - It joins with
geolocationLongitudeLatitudeTransDFtwice, once matching "stateSequenceId" with "latitudeSequenceId" and again matching "stateSequenceId" with "longitudeSequenceId". This suggests that latitude and longitude information might be in the same DataFrame but linked via separate sequence IDs. - It joins with
geolocationMarketTransDFbased on matching "stateSequenceId" and "marketSequenceId". - It joins with
geolocationPopulationTransDFbased on matching "stateSequenceId" and "populationSequenceId".
The image shows a Python code snippet in a Spark environment (likely Databricks) that performs multiple join operations between geolocationSilverTransDF and several other DataFrames (geolocationDistrictTransDF, geolocationCountryTransDF, geolocationLongitudeLatitudeTransDF, geolocationMarketTransDF, geolocationPopulationTransDF). It then selects specific columns from the joined result. The schema of the resulting DataFrame and a sample of its data are also displayed.
Code Breakdown:
geolocationSilverTransDF = geolocationSilverTransDF \
    .join(geolocationDistrictTransDF, col("stateSequenceId") == col("districtSequenceId")) \
    .join(geolocationCountryTransDF, col("stateSequenceId") == col("countryNameSequenceId")) \
    .join(geolocationLongitudeLatitudeTransDF, col("stateSequenceId") == col("latitudeSequenceId")) \
    .join(geolocationLongitudeLatitudeTransDF, col("stateSequenceId") == col("longitudeSequenceId")) \
    .join(geolocationMarketTransDF, col("stateSequenceId") == col("marketSequenceId")) \
    .join(geolocationPopulationTransDF, col("stateSequenceId") == col("populationSequenceId")) \
    .select(
        col("stateName"),
        col("districtName"),
        col("countryName"),
        col("latitude"),
        col("longitude"),
        col("marketName"),
        col("population")
    )

display(geolocationSilverTransDF)
Explanation:
The code performs a series of inner joins:
- It starts with
geolocationSilverTransDF(containing "stateName" and "stateSequenceId"). - It joins with
geolocationDistrictTransDFbased on matching "stateSequenceId" and "districtSequenceId". - It joins with
geolocationCountryTransDFbased on matching "stateSequenceId" and "countryNameSequenceId". - It joins with
geolocationLongitudeLatitudeTransDFtwice, once matching "stateSequenceId" with "latitudeSequenceId" and again matching "stateSequenceId" with "longitudeSequenceId". This suggests that latitude and longitude information might be in the same DataFrame but linked via separate sequence IDs. - It joins with
geolocationMarketTransDFbased on matching "stateSequenceId" and "marketSequenceId". - It joins with
geolocationPopulationTransDFbased on matching "stateSequenceId" and "populationSequenceId".
After performing all these joins, the .select() method chooses the following columns for the final geolocationSilverTransDF: "stateName", "districtName", "countryName", "latitude", "longitude", "marketName", and "population".
Output: geolocationSilverTransDF: pyspark.sql.dataframe.DataFrame = [stateName: string, districtName: string ... 5 more fields]
The schema of the resulting DataFrame shows these seven selected columns, all of type string (except potentially latitude and longitude, though the schema doesn't explicitly state the type).
Output Table (Partial):
The table below shows a sample of the joined and selected data:
Interpretation:
The code is integrating information from multiple related DataFrames based on a common "stateSequenceId" (which acts as a key). It's enriching the initial state information with corresponding district, country, latitude, longitude, market, and population details. The join conditions imply a one-to-many or one-to-one relationship between the state and these other attributes based on the sequence IDs.
It's important to note the potential for data duplication if the join keys are not unique in the joining DataFrames. For example, if multiple districts or markets are associated with the same stateSequenceId, the resulting DataFrame will have multiple rows for that state, each with a different district or market.

Now we have the structured form of data, and we are writing it into the Delta Live tables. because the delta live tables will be stored in columnar storage.


geolocation.MARKETNAME why . is ther ein column name
You're right to question the . (dot) in geolocation.MARKETNAME. It strongly suggests that geolocation is not a top-level column name in the pricing_analytics.silver_geo_location_silver table. Instead, it indicates a nested structure, likely a struct (similar to a dictionary or object) within a column.
Here's why the dot notation is used in SQL and Spark SQL in this context:
- Accessing Fields within a Struct: When you have a column that contains complex data types like structs, you use dot notation to access the individual fields within that struct.
Scenario:
It's highly probable that when the geocoding data was transformed and loaded into the silver table, the API response or a portion of it was stored as a struct in a column named geolocation. This geolocation struct then contains various fields, one of which is MARKETNAME.
Example Structure (Conceptual):
Imagine the pricing_analytics.silver_geo_location_silver table has a schema something like this:
root
 |-- stateName: string
 |-- districtName: string
 |-- countryName: string
 |-- geolocation: struct (nullable = true)
 |    |-- MARKETNAME: string (nullable = true)
 |    |-- latitude: double (nullable = true)
 |    |-- longitude: double (nullable = true)
 |    |-- ... other geocoding details ...
 |-- ... other top-level columns ...
In this structure, geolocation is a column of type struct, and MARKETNAME, latitude, and longitude are fields within that struct.
How the SQL Query Works:
The SQL query select * from pricing_analytics.silver_geo_location_silver where geolocation.MARKETNAME = 'Guntur' is:
- Selecting all columns (
*) from thepricing_analytics.silver_geo_location_silvertable. - Filtering the rows (
where) based on a condition. - The condition
geolocation.MARKETNAME = 'Guntur'specifies that we only want rows where the value of theMARKETNAMEfield inside thegeolocationstruct is equal to the string 'Guntur'.
Why the Data Might Be Structured This Way:
Grouping related information into structs is a common practice for several reasons:
- Organization: It helps to keep related attributes together, making the data model more organized and easier to understand conceptually.
- Schema Evolution: If the structure of the geocoding information from the API changes, encapsulating it within a struct can make schema evolution easier to manage. You might add new fields to the struct without necessarily altering the top-level schema of the table.
- Data Source Representation: It can reflect the original structure of the data source (e.g., the nested JSON response from an API).

Comments
Post a Comment